The Appraising Risk partnership is developing a variety of innovative approaches to the extraction and digitization of historical data from cartographic source materials. Central to the project’s goal of developing historically accurate GIS-ready spatial datasets covering the Indian Ocean World is the development of shapefiles that represent the political, social and environmental units by which the Indian Ocean World was divided, measured, organized and understood by its inhabitants.
Key to achieving this goal is developing automated, efficient, and accurate methods to extract historical data from map images. Using maps collected from a wide range of time periods and locations, we have begun the process of converting these documents from static images to dynamic GIS shapefiles. The digitization of map images into shapefiles allows us to utilize the map data in innovative and dynamic ways, enabling us to compile rich spatial references throughout the history of the Indian Ocean World. With these shapefiles, we are able to perform spatial analysis, assemble temporal databases containing hundreds of thousands of unique locations (our temporal gazetteer), compare cartographic data from different time periods, and produce our own maps and visualizations.
One of our most exciting projects showcasing these techniques has been our digitization of India Census Districts from 1872 to the Present. The goal of this project was to digitize the borders of every administrative district found in the national census of India documents provided by The Office of the Registrar General & Census Commissioner. The maps contained in these census booklets provide the historical borders of each census district, along with its name and its type (whether a British district or a Princely State), as well as the relevant census data. Digitizing these historical district borders represents the only known shapefiles yet produced of the administrative boundaries of late 19th century and early 20th century India, providing a comprehensive and dynamic set of resources containing historical population data. These shapefiles will be a benefit to historians and other researchers interested in changes that have occurred in India in the 19th and 20th century. As district shapefiles do exist for contemporary India, our contributions would allow a continuity between 1872 to the present day.
Digitizing Shapefiles from Historical Maps
The process of map digitization utilizes custom workflow and tracing algorithms developed at the Indian Ocean World Centre, allowing researchers to begin with a color or black-and-white scan of a map, and to digitally process and trace that map to derive a set of shapefiles which follow the borders and boundaries contained in the source map. While various digitization techniques have existed for over a decade, they usually require specialist knowledge of Geographic Information Systems and significant investments of time for each map, often relying on hand-tracing techniques. Our methodology includes automated processing and tracing, reducing the technical difficulty as well as the time needed to process a map. While our development is still in an early stage, we have managed to achieve 20-fold reduction in the time required to complete the digitization, indicating the possibility of digitizing large archives of cartographic material. The India Census District maps outlined below are representative of the process we use to generate shapefiles from a variety of source maps.


After selecting a source map, the first step uses our image pre-processing algorithm (built with Python’s imagemagick libary) to prepare and edit map images, accentuating the color and detail elements that aid the later tracing process. These processed maps are cleaned and annotated by the user, and imported into GIS Software (in our case, Esri’s ArcGIS suite). At this point, the images contain no spatial reference, and the computer does not yet recognize them as representing a particular area on the earth’s surface. To rectify this, we geo-reference the images, selecting points on the image and then assigning their respective coordinates on the surface of the earth. With 15-30 such reference points, the map image is warped so that it properly aligns with the real-world location it represents. Quite often, we discover that the maps do not entirely line up with our present-day map. These discrepancies are documented, as they often represent critical data about the limitations of the source map or possibly changes that have occurred in the region between the map’s creation and the present day (such as when coast-lines change due to rising sea levels).
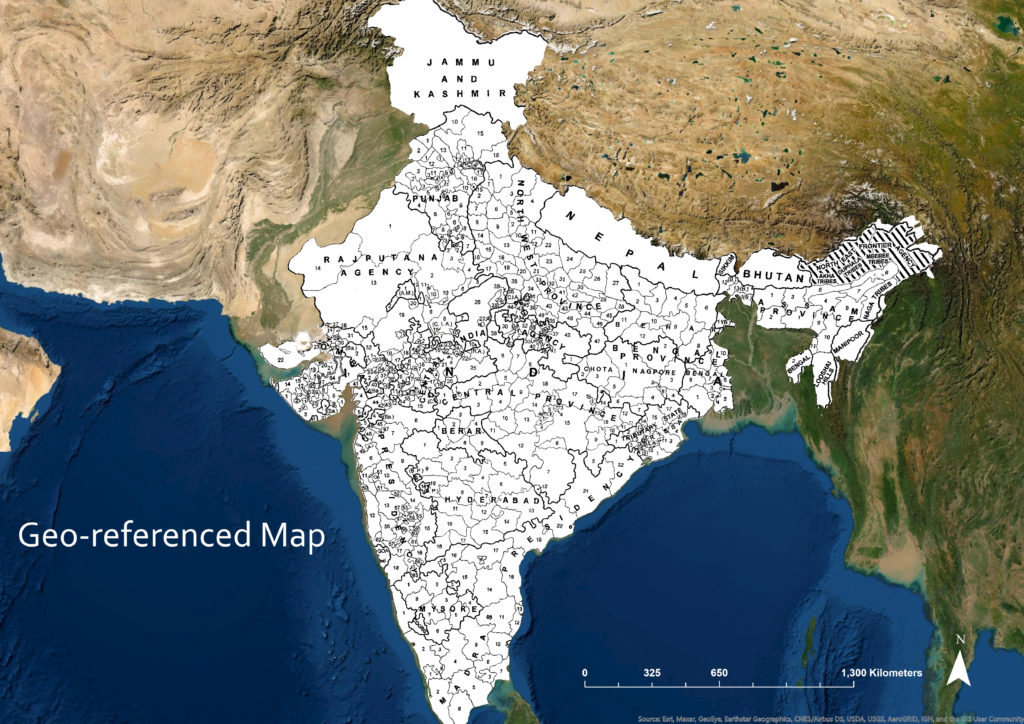
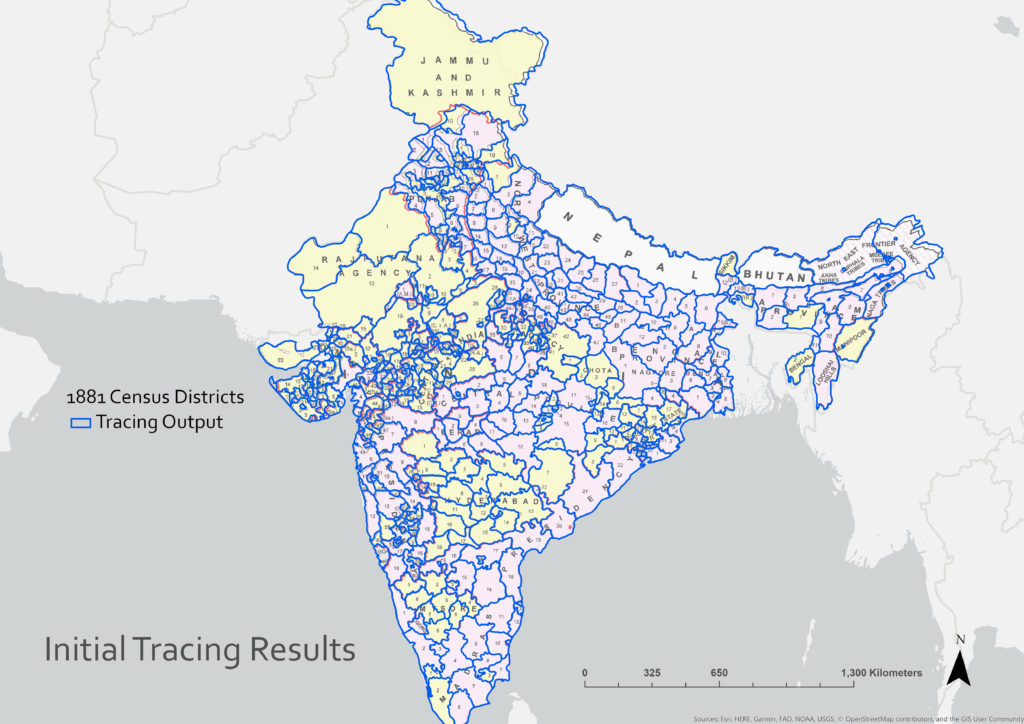
With the source map correctly aligned to its real-world location, we begin the automated tracing process, instructing the program to follow only the black lines and disregard the white background and small, unconnected line segments. The tracing outputs are viewed, corrected, and re-processed, with multiple iterative tracings being combined for the final shapes. In contrast with hand-tracing thousands of irregular shapes using a mouse, automated tracing can cut the overall digitization time by %90-95. While the tracing process that produced the first round results below required 3 tracing iterations and 25 minutes of final editing and clean-up (28 minutes total), an attempt to hand-trace the same level of detail required 2 hours and 55 minutes, reflecting a %625 improvement in speed. Further improvements of the pre-processing and tracing algorithms promise continued improvement of the total time to trace.
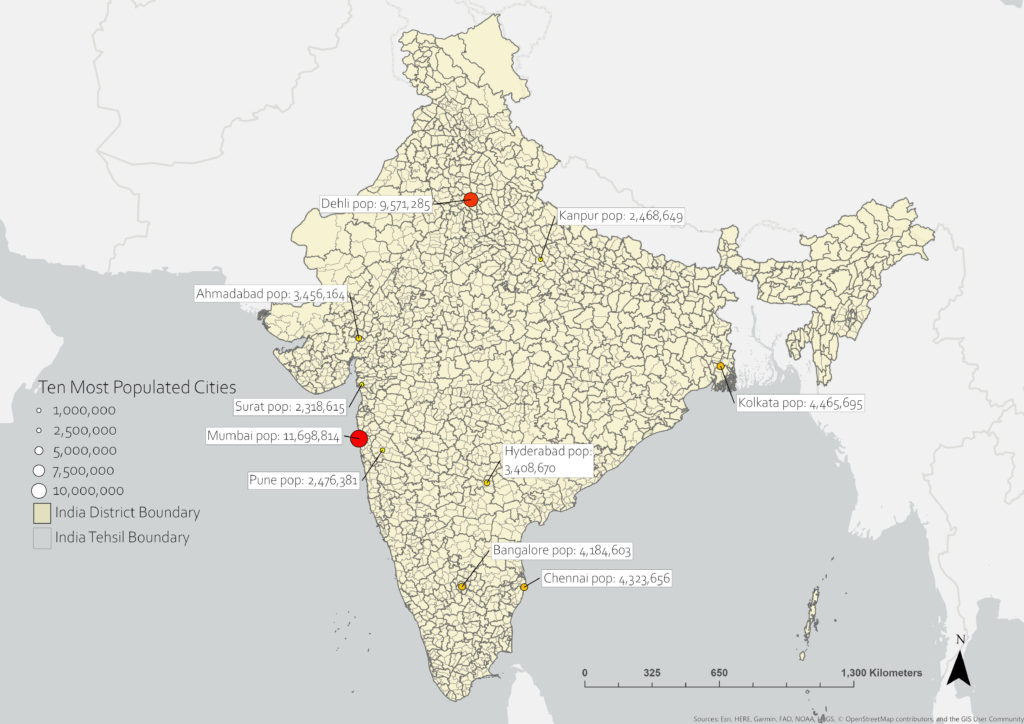
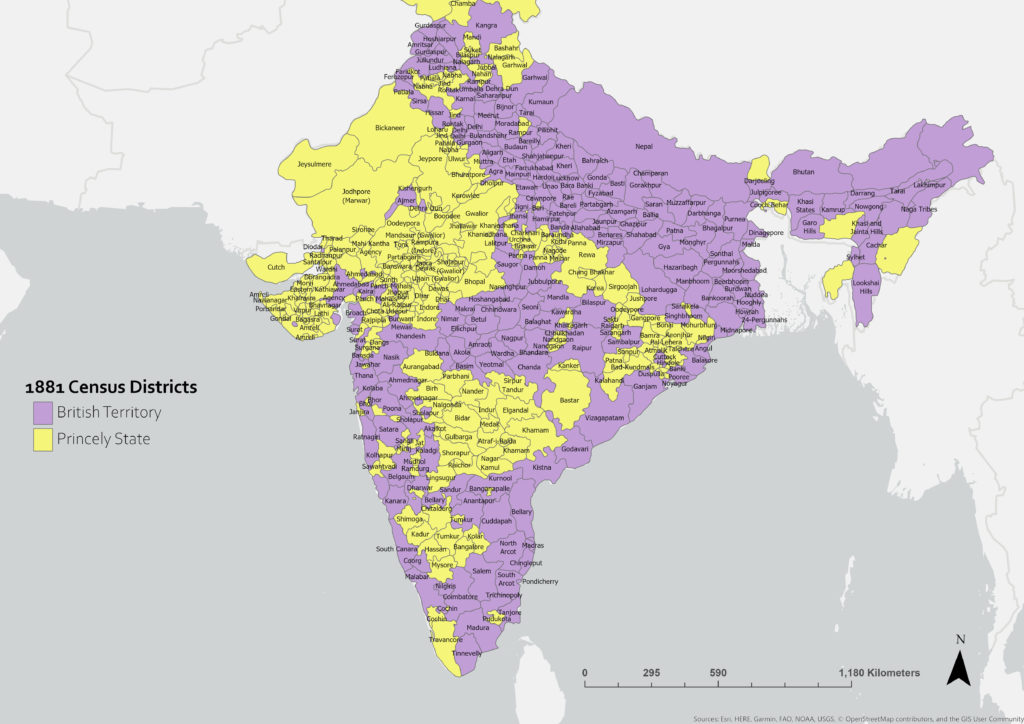
Once we have the borders of each shape traced, we can convert them to polygons and attach relevant data to each shape. In this case we have attached the name of each district from the census document, as well as its type – British Territory or Princely State. The completed shapefile is now ready to be utilized and distributed, with each user having the ability to add data to the shapefiles themselves, or to layer other datasets on top of the district shapefiles. In the following example, we have included the top ten most populated cities in India for the year 1881, utilizing historical urban population data provided by NASA’s Socioeconomic Data and Applications Center (SEDAC).
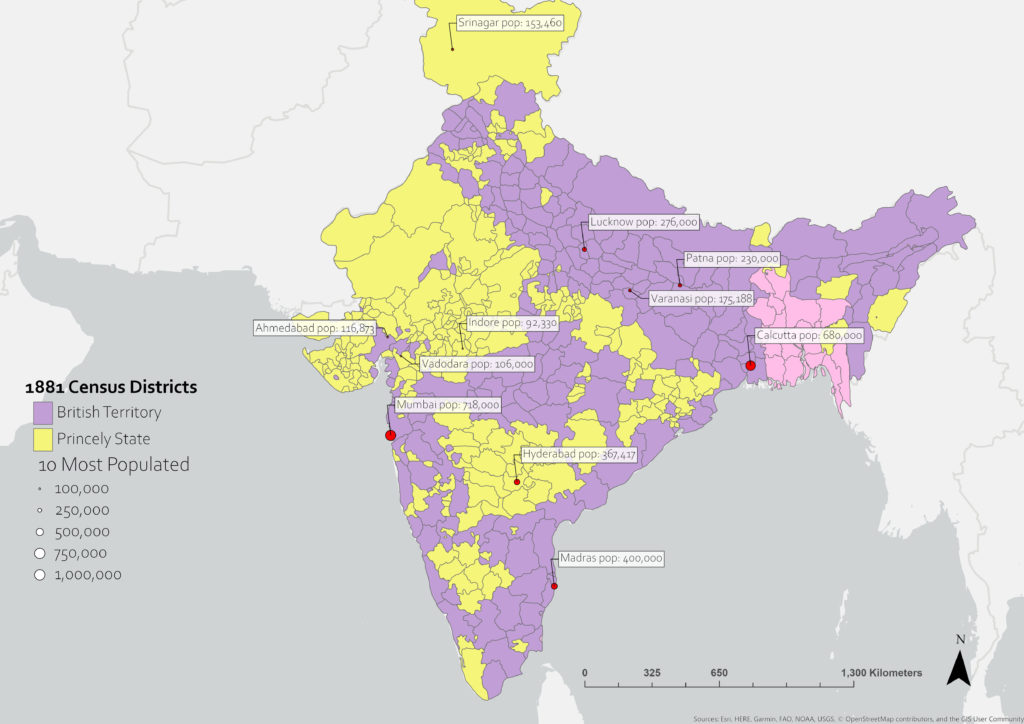
Following the same process, we have been able to generate historical district shapefiles for India in the years 1872, 1881, and 1891. As shapefiles are available for the period from 1947 to the Present day, our contribution of accurate, detailed shapefiles from the period of 1872-1891 will allow researchers to pursue analyses and inquiry using a continuous spatial record from the 19th century. The 1872, 1881, and 1891 India District shapefiles are still being finished, and we will post further updates and analysis using these shapefiles in the future.
Click the left and right buttons on the slider below to see the district divisions and ten most populous cities in India in 1881 compared to 2001
